Source: David Eltis and David Richardson, Atlas of the Transatlantic Slave Trade (New Haven, 2010), reproduced with the permission of Yale University Press. For permission to reuse these images, contact Yale University Press.
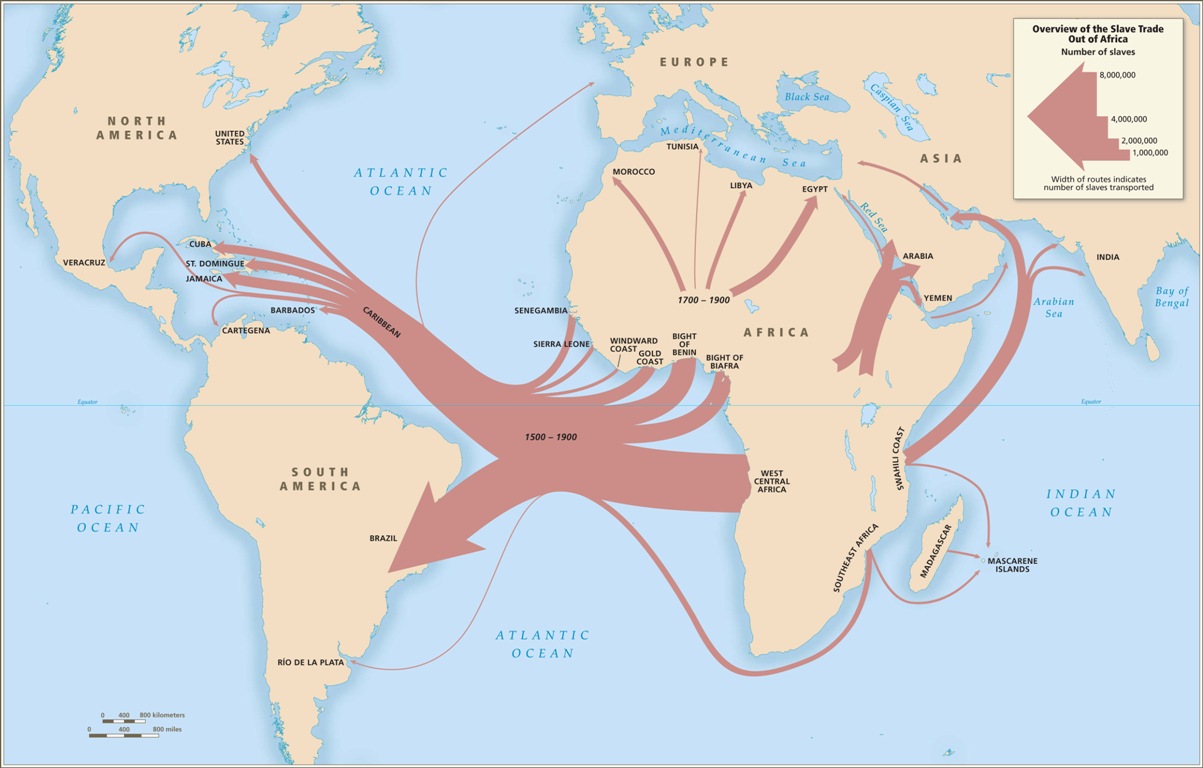
1. Overview of the slave trade out of Africa, 1500-1900
Captive Africans followed many routes from their homelands to other parts of the world. The map shows the trans-Atlantic movement of these captives in comparative perspective for the centuries since 1500 only. Estimates of the ocean-borne trade are more robust than are those for the trans-Saharan, Red Sea and Persian Gulf routes, but it is thought that for the period from the end of the Roman Empire to 1900 about the same number of captives crossed the Atlantic as left Africa by all other routes combined.
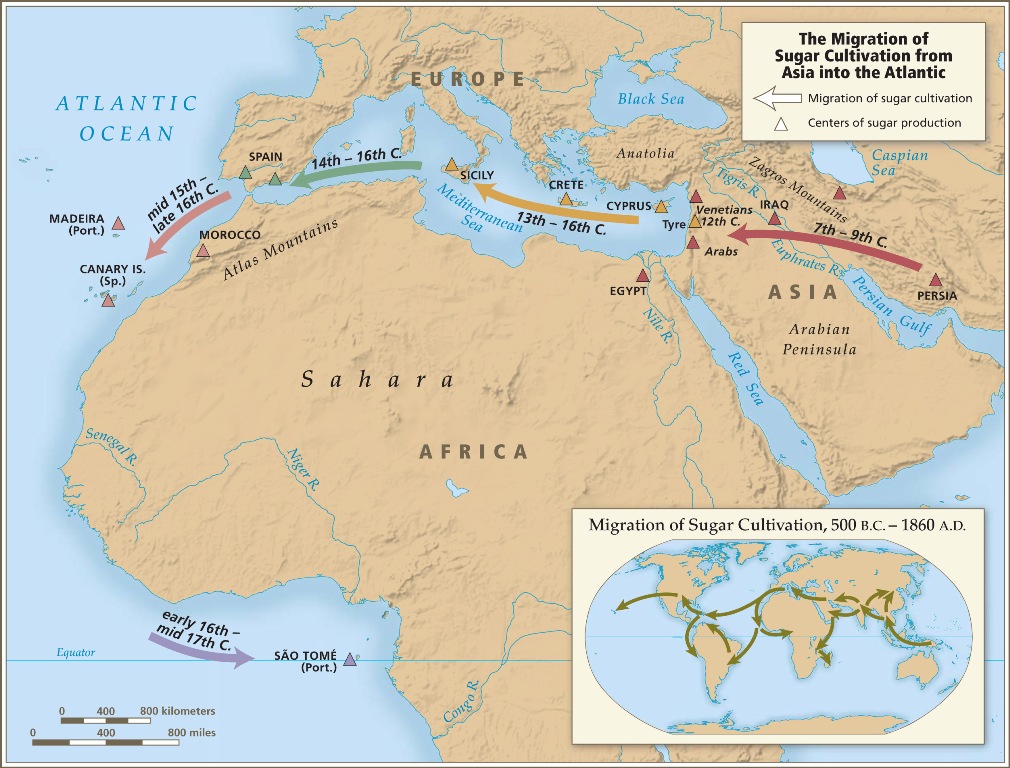
2. Migration of sugar cultivation from Asia into the Atlantic
Sugar cultivation began in the Pacific in the pre-Christian era and gradually spread to the eastern Mediterranean, the Gulf of Guinea, then to Brazil, before entering the Caribbean in the mid-seventeenth century. Eighty percent of all captives carried from Africa were taken to sugar-growing areas.
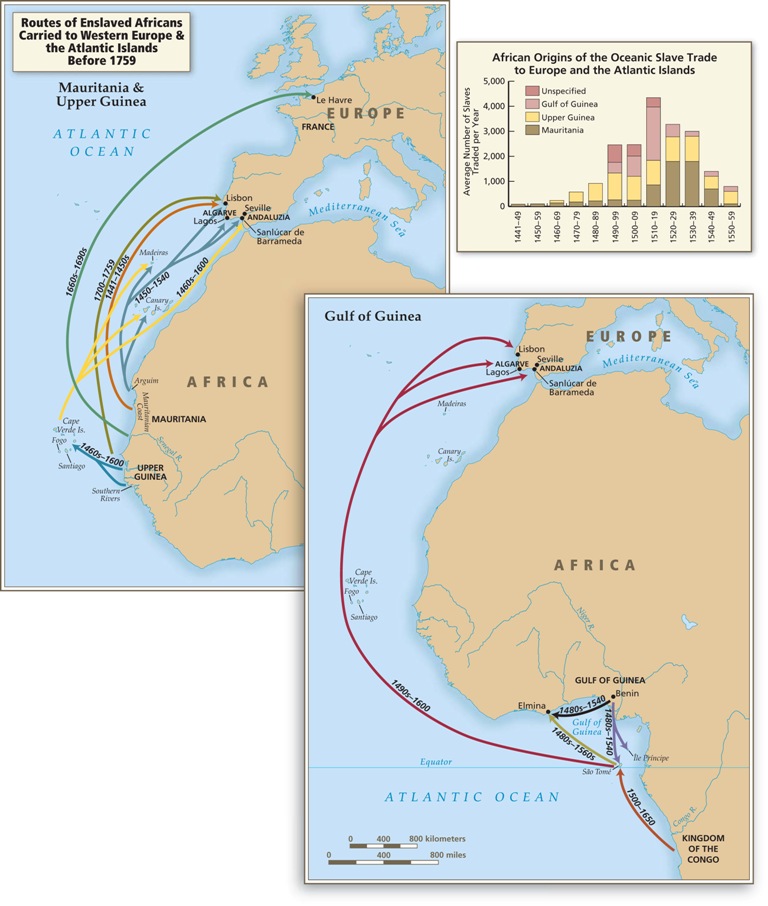
3. Old World slave trade routes in the Atlantic before 1759
Before the Atlantic slave trade began and for two centuries thereafter, some African captives were taken to Europe as well as to the Atlantic islands and between African ports. It is hard to get precise estimates of these flows, but they were certainly much smaller than the trans-Atlantic traffic. Many of the captives involved in this traffic were subsequently carried to sugar plantations in the Old World.
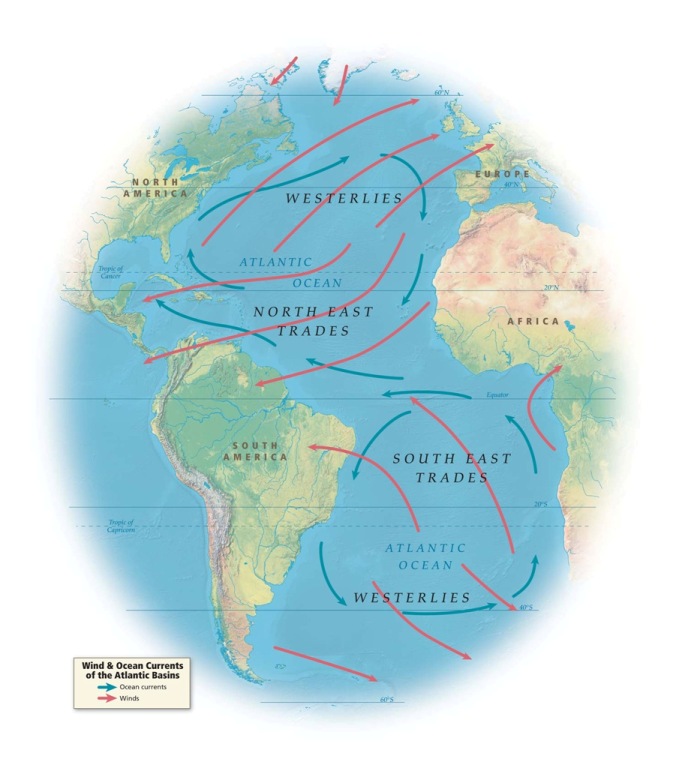
4. Wind and ocean currents of the Atlantic basins
In the age of sail, winds and ocean currents shaped the direction of the trans-Atlantic slave trade, effectively creating two separate slave-trading systems, one in the north with voyages originating in Europe and North America, the other in the south with voyages originating in Brazil.
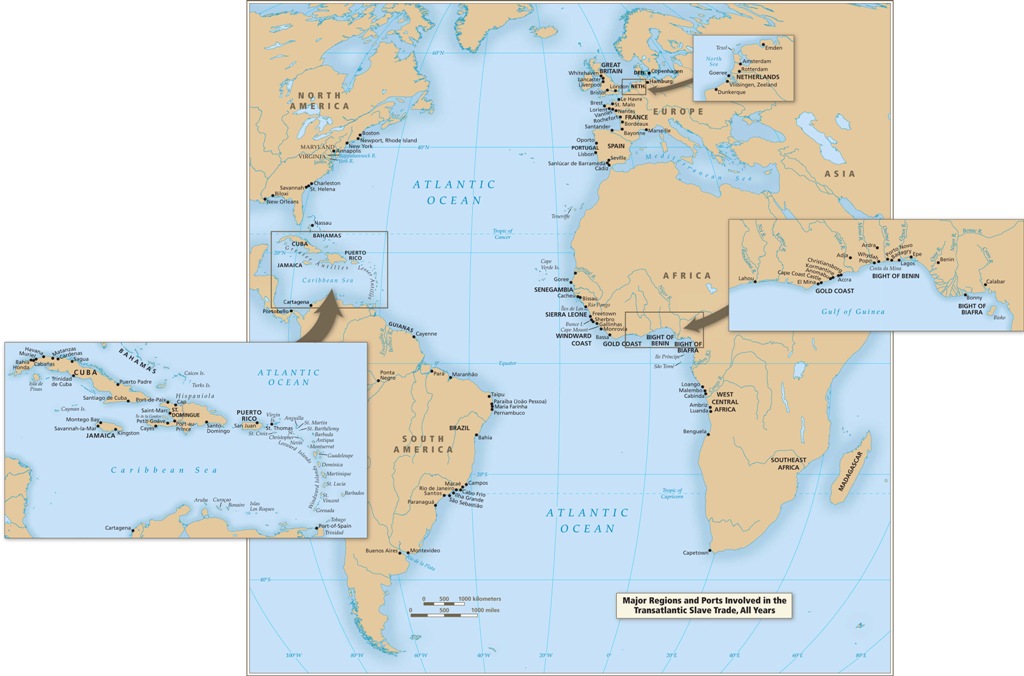
5. Major regions and ports involved in the trans-Atlantic slave trade, all years
Few commercial centers in the Atlantic world were untouched by the slave trade, and all the major ports had strong connections with the traffic.
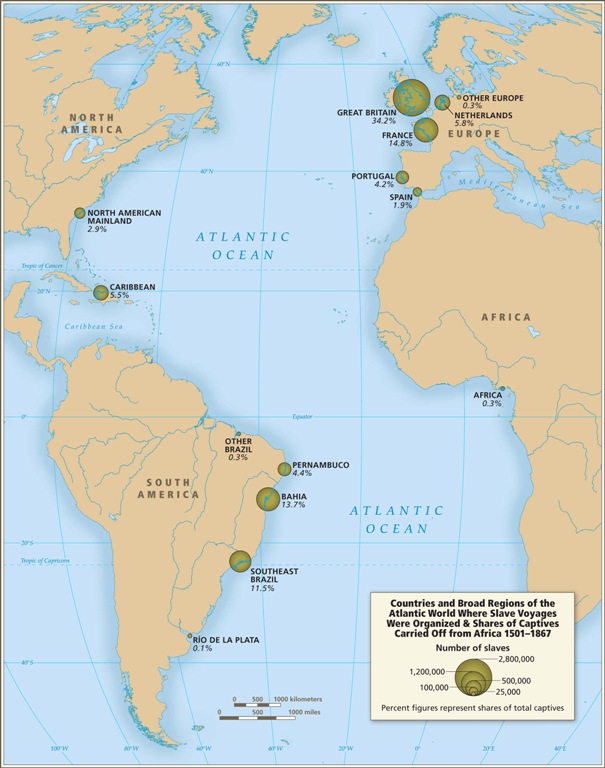
6. Countries and regions in the Atlantic World where slave voyages were organized by share of captives carried off from Africa
Slave voyages were organized and left from all major Atlantic ports at some point over the nearly four centuries of the trans-Atlantic slave trade. Nevertheless, vessels from the largest seven ports, Rio de Janeiro, Bahia, Liverpool, London, Nantes, Bristol, and Pernambuco carried off almost three-quarters of all captives removed from Africa via the Atlantic Ocean. There was a major shift in the organization of slaving voyages first from the Iberian peninsular to Northern Europe, and then later back again to ports in southern Europe. A similar, but less pronounced shift may be observed in the Americas from South to North and then back again.
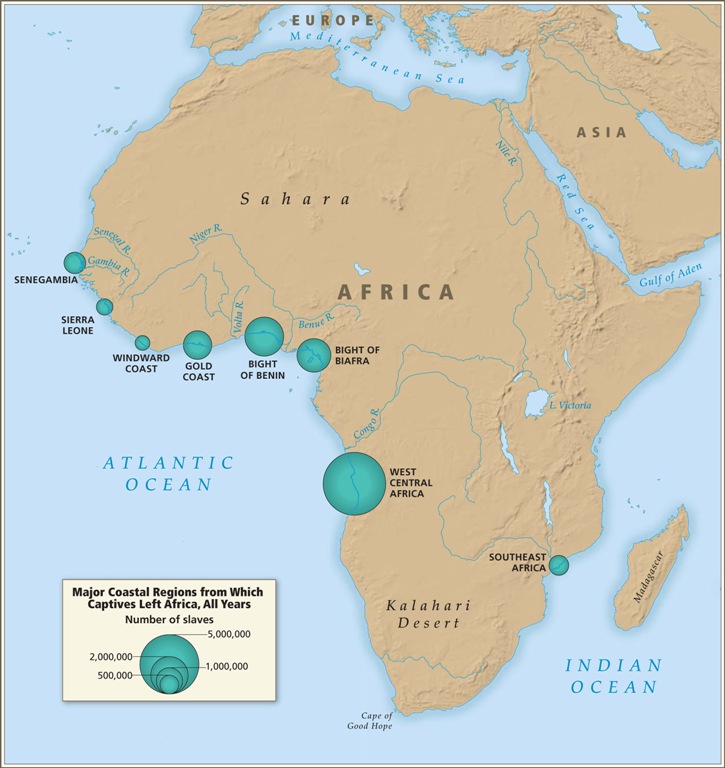
7. Major coastal regions from which captives left Africa
The limits of the regions shown here are 'Senegambia,' anywhere north of the Rio Nunez. Sierra Leone region comprises the Rio Nunez to just short of Cape Mount. The Windward Coast is defined as Cape Mount south-east to and including the Assini river. The Gold Coast runs east of here up to and including the Volta River. Bight of Benin covers the Rio Volta to Rio Nun, and the Bight of Biafra, east of the Nun to Cape Lopez inclusive. West-central Africa is defined as the rest of the western coast of the continent south of this point, and south-eastern Africa anywhere from and to the north and east of the Cape of Good Hope. West-Central Africa was the largest regional departure point for captives through most the slave trade era. Regions closer to the Americas and Europe generated a relatively small share of the total carried across the Atlantic. Voyage length was determined as much by wind and ocean currents shown in Map 4 as by relative proximity of ports of embarkation and disembarkation.
Total documented embarkations: 7,878,500 captives
Percent of estimated embarkations: 63.3%
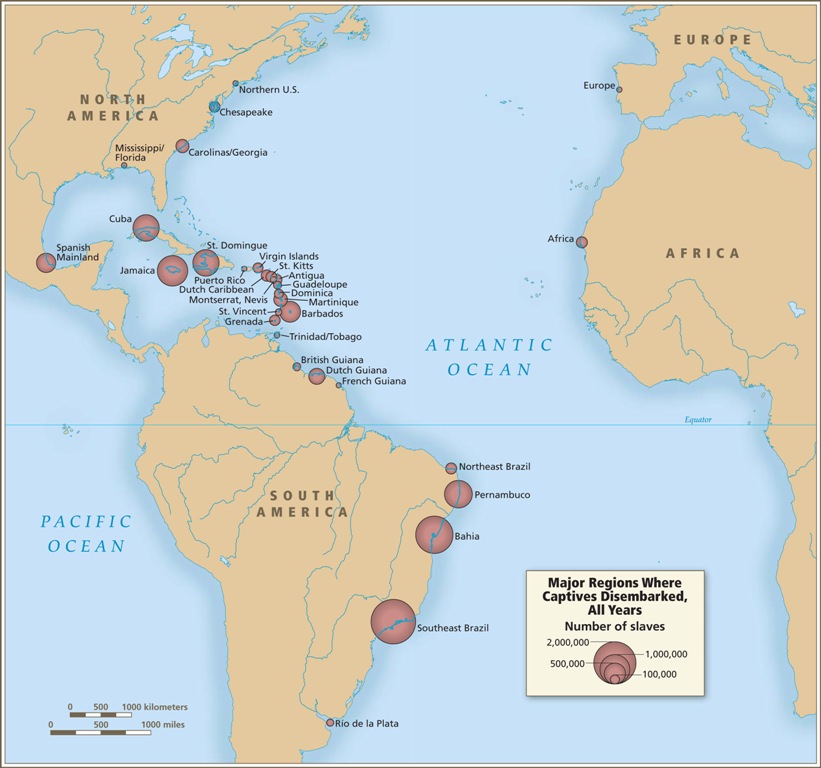
8. Major regions where captives disembarked
The Caribbean and South America received 95 percent of the slaves arriving in the Americas. Some captives disembarked in Africa rather than the Americas because their trans-Atlantic voyage was diverted as a result of a slave rebellion or, during the era of suppression, because of capture by patrolling naval cruisers. Less than 4 percent disembarked in North America, and only just over 10,000 in Europe.
Total documented embarkations: 9,371,001 captives
Percent of estimated embarkations: 88.5%
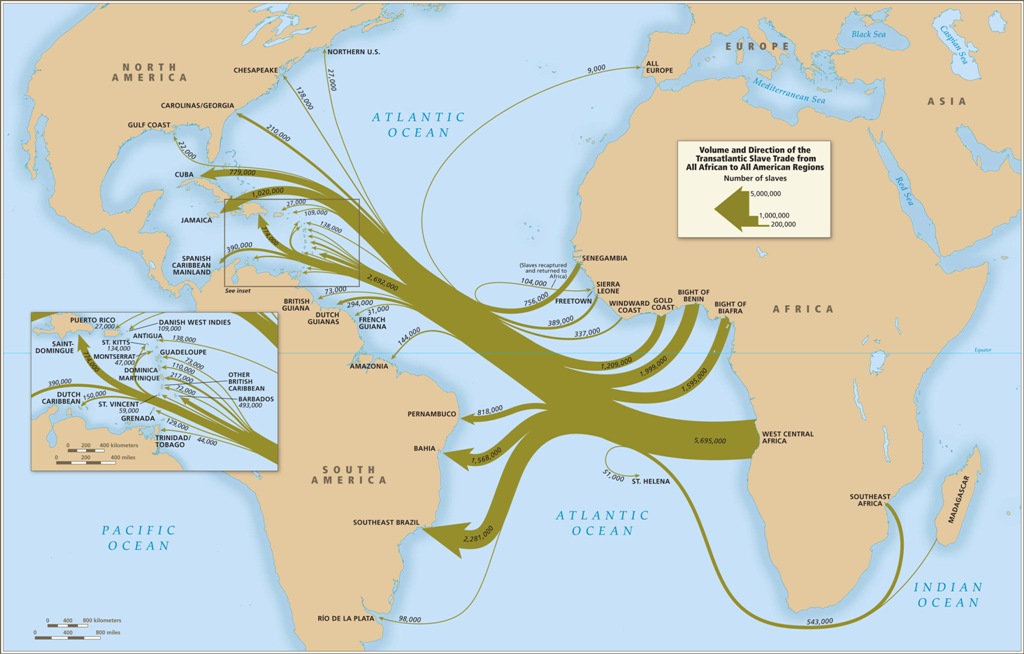
9. Volume and direction of the trans-Atlantic slave trade from all African to all American regions
This map summarizes and combines the many different paths by which captives left Africa and reached the Americas. While there were strong connections between particular embarkation and disembarkation regions, it was also the case that captives from any of the major regions of Africa could disembark in almost any of the major regions of the Americas. Even captives leaving Southeast Africa, the region most remote from the Americas, could disembark in mainland North America, as well as the Caribbean and South America. The data in this map are based on estimates of the total slave trade rather than documented departures and arrivals.